|
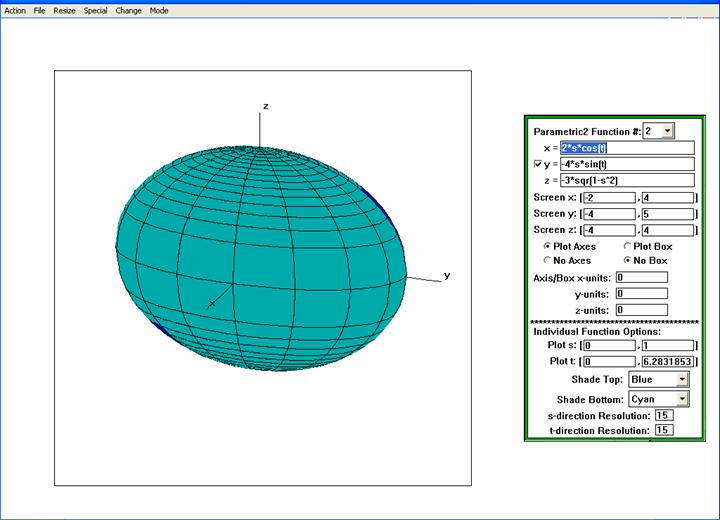
Ellipsoid |
|
Example 1
(page 841):

The top half of the ellipsoid below is
parameterized as
 whereas
the bottom half is parameterized as whereas
the bottom half is parameterized as
 . .
 |
|
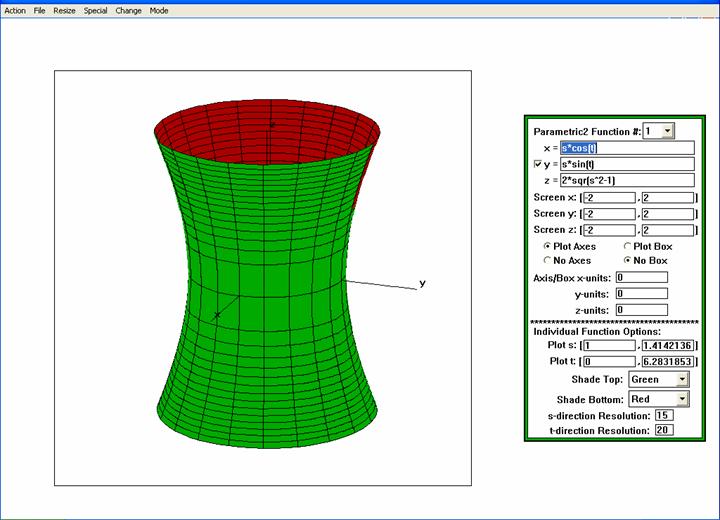
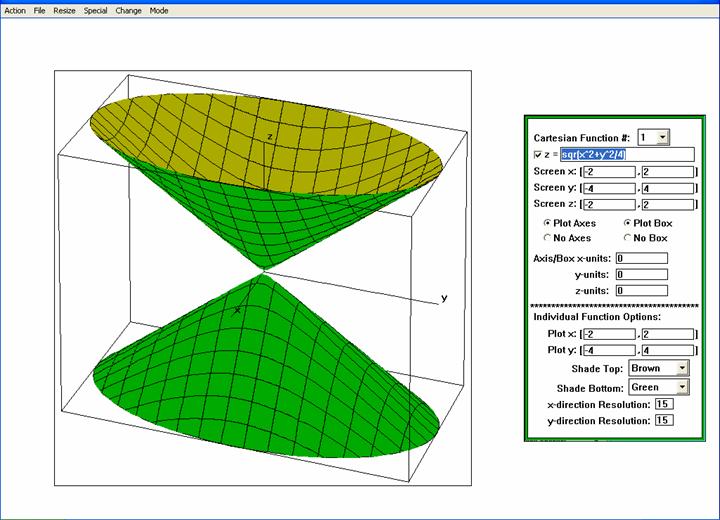
Hyperboloid of One Sheet |
|
Example 2
(page 842):

The top half of the hyperboloid of one
sheet shown below is parameterized as
 and
the bottom and
the bottom
half is parameterized as
 .
The plot-s interval is .
The plot-s interval is
 and
the plot-t interval is and
the plot-t interval is
 for
both for
both
parameterizations.
|
|
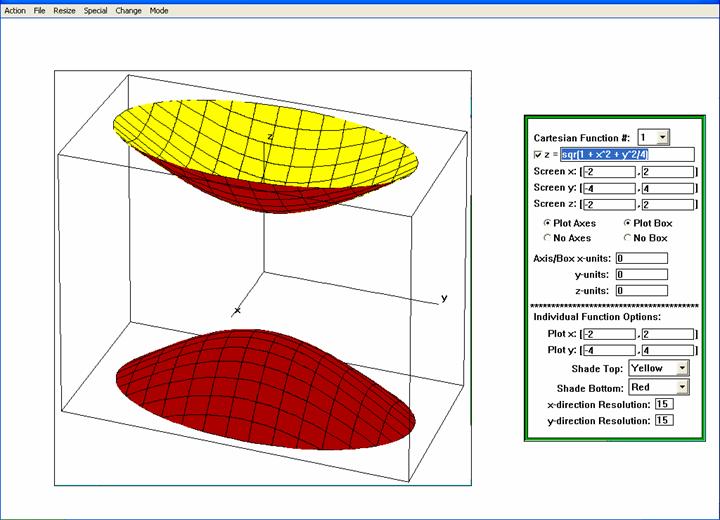
Hyperboloid of Two Sheets |
|
Example 3
(page 843):

The figure below is generated in the
Cartesian mode. The equation for the top branch of the
surface is  and
for the bottom branch the equation is and
for the bottom branch the equation is
 . .
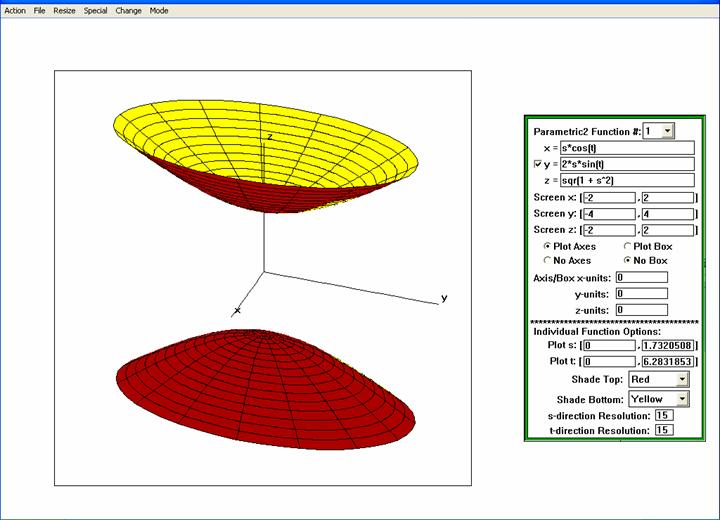
As an alternative, the parametric (2
variables) mode can be used to generate the surface. In the
figure below the top branch of the surface is parameterized
as  and
the bottom half is parameterized as and
the bottom half is parameterized as
 . .
The plot-s interval is  and the
plot-t interval is for
both parameterizations. and the
plot-t interval is for
both parameterizations.
|
|
Elliptic Cone |
|
Example 4
(page 843):

The figure below is generated in the
Cartesian mode. The top half of the cone has equation  with
the "top" shaded brown and the "bottom" shaded green. The
bottom half of the cone has equation with
the "top" shaded brown and the "bottom" shaded green. The
bottom half of the cone has equation
 with
the "top" shaded green and the "bottom”" shaded brown. with
the "top" shaded green and the "bottom”" shaded brown.
As an alternative, the parametric (2 variables) mode can be
used to generate the surface. In the figure below the top
branch of the surface is parameterized as
 and
the bottom half is parameterized as and
the bottom half is parameterized as . .
The plot-s interval is
 and
the plot-t interval is and
the plot-t interval is
 for
both parameterizations. for
both parameterizations.
 |
|
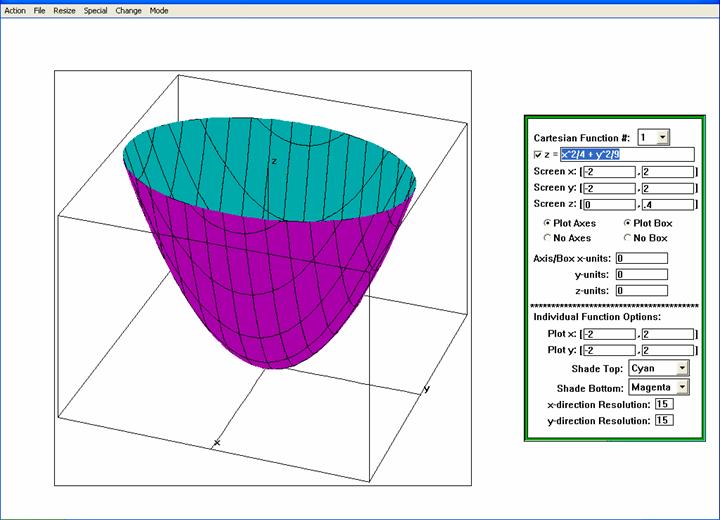
Elliptic Paraboloid |
|
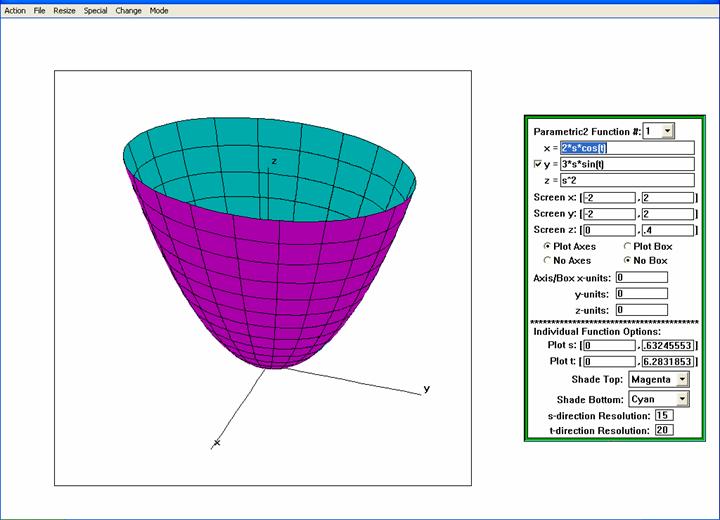
Example 5 (page 844):

The figure below is generated in the
Cartesian mode. The viewer angle with the z-axis
is 85 degrees.
As an alternative, the parametric (2
variables) mode can be used to generate the surface. In the
figure below the surface is parameterized as
 .
The plot-s interval is .
The plot-s interval is
 and
the plot-t interval is
. and
the plot-t interval is
.
 |
|
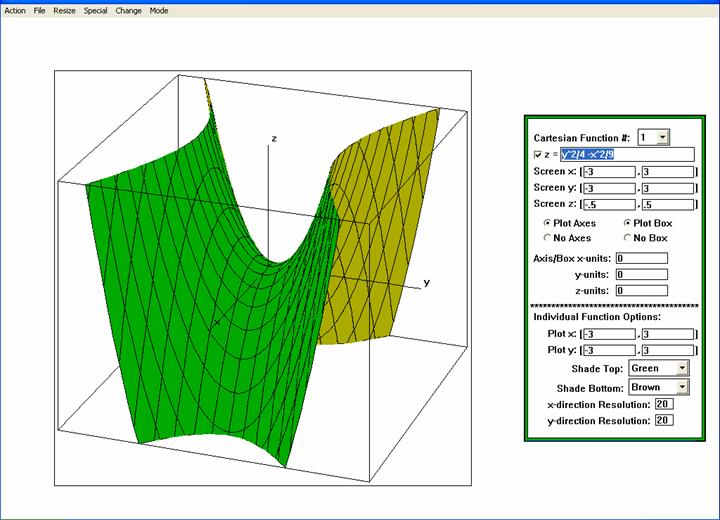
Hyperbolic Paraboloid |
|
Example 6 (page
844):

In the figure below the viewer angle with
the z-axis is 85 degrees.
 |