|
Exercise 14.7.7 (Page 994):
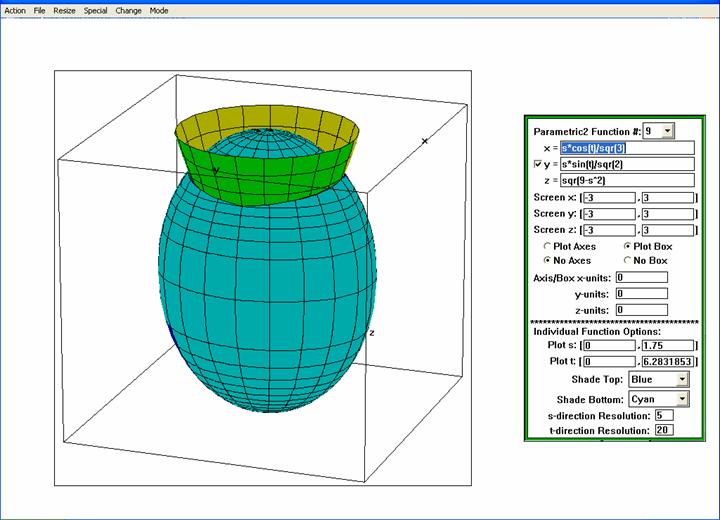
This figure is showing the intersection of the paraboloid
 and
the ellipsoid and
the ellipsoid  .
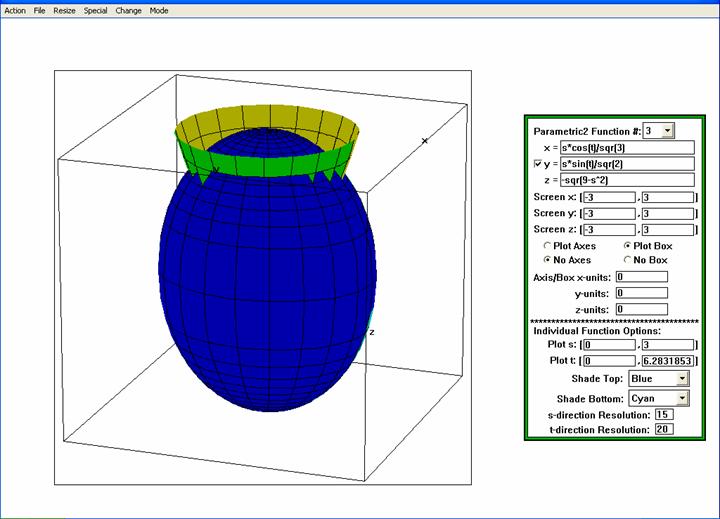
Each of these surfaces can be fairly easily parameterized. First
: .
Each of these surfaces can be fairly easily parameterized. First
:
 , ,
 , ,
 .
For the top half of the ellipsoid
: .
For the top half of the ellipsoid
: , ,
 ,
and
for the bottom half: ,
and
for the bottom half:  ,
,
.
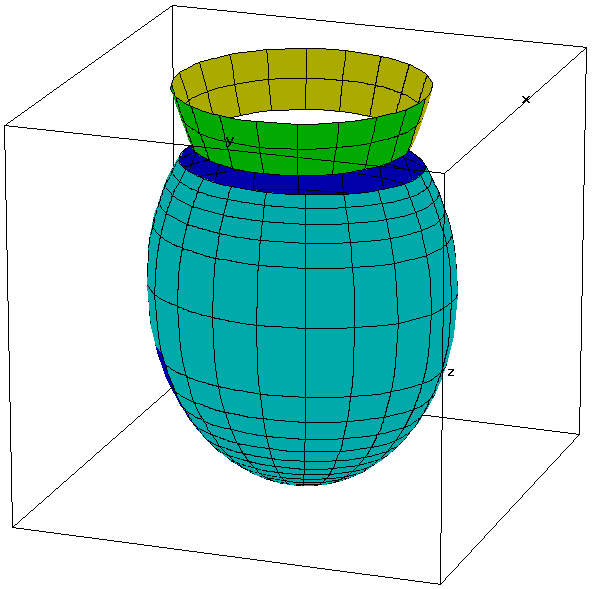
A first attempt of this graph is shown below. ,
,
.
A first attempt of this graph is shown below.
This figure gives a good depiction of each of
the individual surfaces, but it does not show the intersection
well. This is the problem of surface elements from two different
functions that overlap. The following addresses this problem by
using a total of 9 different parameterizations. First, the
bottom of the ellipsoid is parameterized as before.
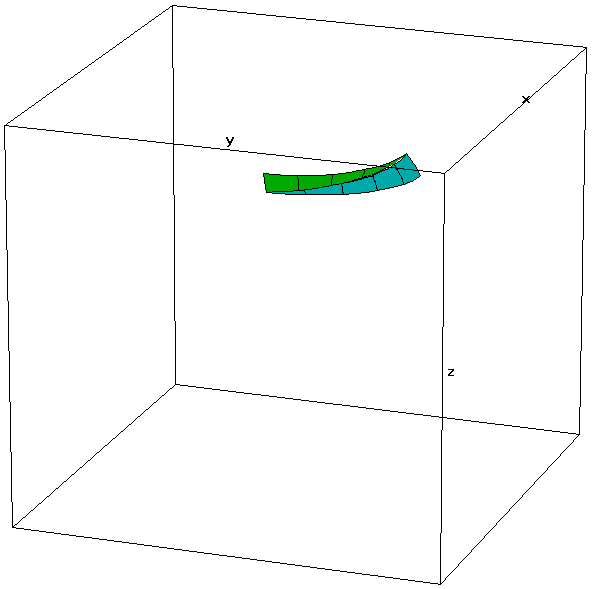
For
 ,
parameterize the piece of the parabola as ,
parameterize the piece of the parabola as

and the ellipsoid as
 , ,
 .
Neither of these surfaces are visible for .
Neither of these surfaces are visible for
 and
for and
for  ,
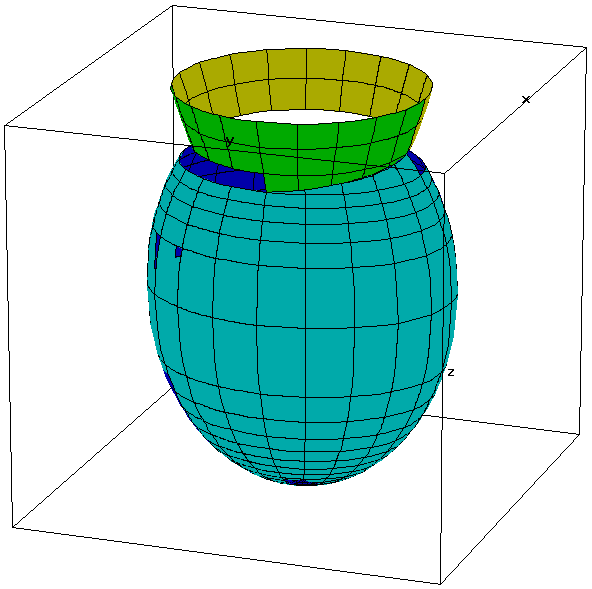
only the ellipsoid is visible. Parameterize it as ,
only the ellipsoid is visible. Parameterize it as
 ,
.
Finally to get the top of the ellipsoid use its original ,
.
Finally to get the top of the ellipsoid use its original
parameterization with
 and
,
set the s-direction resolution to 5 and the t-direction
resolution to 20. Putting all of these parameterizations together
gives the graph below. and
,
set the s-direction resolution to 5 and the t-direction
resolution to 20. Putting all of these parameterizations together
gives the graph below.
 |