|
|||
|
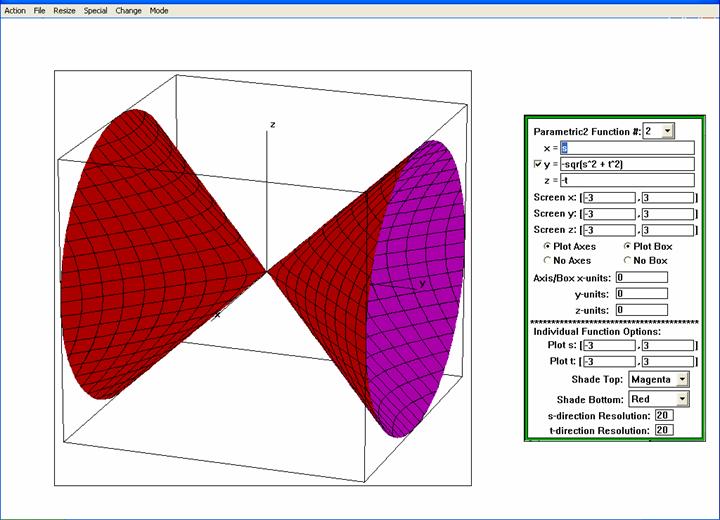
Figure 12.7.17 (Page 847):
(A Circular Cone) 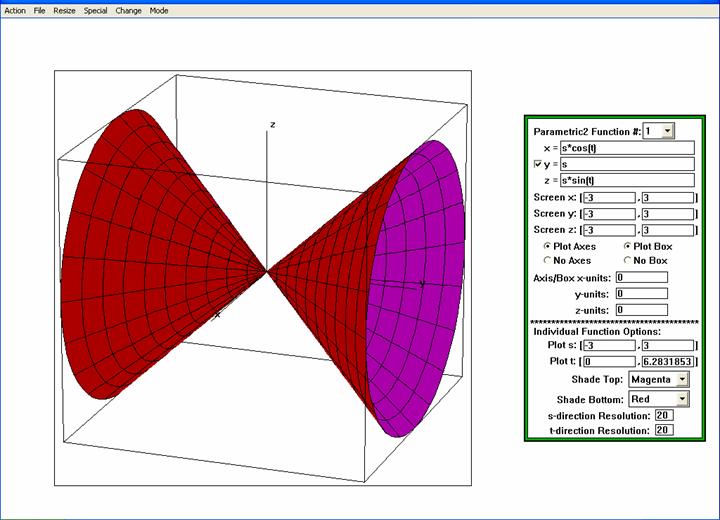 Note that this figure is not exactly like Figure 12.7.17, since the parameterization used produced different constant coordinate curves. To get the constant coordinate curves of Figure 12.7.17, we can use two functions: Function #1:
The plot s-interval for each function is
 |


| Previous | Next |